I have received about a hundred requests for a version of PowerDrive that I have never tried. Each different version would require some thinking, some calculations, some breadboarding, and measurement, and tweaking before it would be ready for use. It is impossible for me to do all of this, so I am attempting to explain the steps that I use when I am setting one of these up in my lab. One of the most common questions is, can PowerDrive be used in a push pull amp? Yes, I have such an amp running on my workbench. It is designed the same way as a SE PowerDrive circuit, you just need 2 of them. Where it doesn't fit is the case where a split load phase splitter directly feeds the output tubes. You can't put a CCS in the cathode and a second CCS in the plate of the same tube (you can use the mosfet buffers though). My amp has a LTP phase splitter as the first stage, and 2 separate driver tubes for the second stages (one feeding each output tube). This topology is used in my 300Beast amp, and in a 6AV5 screen drive (yes PowerDrive does this too) push pull amp.
Before you can even think about a PowerDrive circuit you need to know the AC drive and DC bias conditions for the chosen output tube under the chosen conditions. This can be determined graphically from the tube curves, of experimentally by measuring the actual performance of the chosen tube at the chosen supply voltage. Often simple approximations are adequate.
A driver tube must be chosen that deliver the required voltage swing without distortion. In theory the optimum load for a triode driver tube is an open circuit. Since this is impossible, the CCS can provide nearly an open circuit for the DC condition while the high input impedance of the mosfet follower provides nearly an open circuit for the AC conditions for all frequencies in (or near) the audio range. In practice there are a few tubes and operating points that may sound better with a lower impedance load than the CCS provides. This can be determined only by experimentation. The CCS often provides better results than a resistive load when the driver tube is a triode, or triode wired pentode. Pure pentode driver tubes often provide the best performance into a resistive load.
It should be noted that the two circuits that comprise PowerDrive (on either side of the coupling cap) are completely independent. They can be built and optimized independently of each other. In fact you don't have to use both circuits if you don't need or want to. My Tubelab SSE amp uses the CCS IC on the 12AT7 driver tube in order to get high gain and low distortion. It does not use a mosfet follower because the additional circuitry (negative voltage supply, mosfets, bias adjustments) were beyond the scope of this project, a SSE amp with no adjustments required. It is possible to use a choke or resistive load on the driver tube and the mosfet follower. The combination of choke load, and mosfet follower often provides the highest possible output voltage swing at the lowest distortion.
Next we will analyze the individual requirements for setting up your PowerDrive circuit. Some practical examples are shown later.
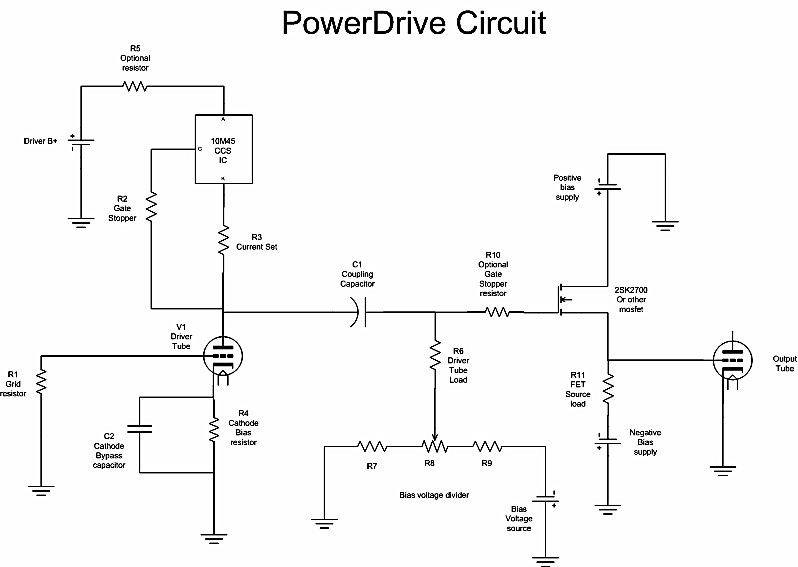
The Output Stage and its Drive and Bias Requirements
First we will analyze the drive requirements of the output tube. If you have access to any vacuum tube modeling software, it can often be the most accurate method to determine the DC and AC requirements simultaneously. I have used SE amp cad and the push pull calculator from TubeCad for this task. It allows experimentation with the bias, drive, load, and B+ voltages to determine the most optimum operating conditions for a variety of tube types. I will go through the use of this program to determine bias and drive requirements for an 845 in SE with an 1100 volt power supply. This just happens to be the conditions used in my 845SE amplifier. Choose the tube, transformer, and bias current that matches the amplifier that you are building.
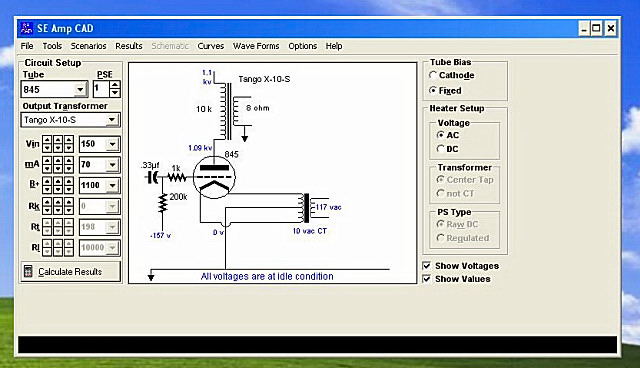
In the initial screen, you see the basic schematic for an SE output stage. In the circuit setup panel on the left, change the tube type to 845, then choose a 10K output transformer. I set the B+ voltage to 1100 volts since this is what my power supply puts out. If you are building an amplifier from scratch, it is another variable that you can adjust. Set the bias current (labeled mA) to the value that you intend to operate the tube at. In this case I am starting with 70mA which gives dissipation of 80 watts which is 80% of the maximum rating for an 845. The Vin slider represents the drive voltage in peak volts that the output tube requires to operate under your chosen conditions. For now, just leave it alone. In the upper right panel choose fixed bias. When the schematic looks right, press the "calculate results" button. Click the options pull down, and check "output in RMS".
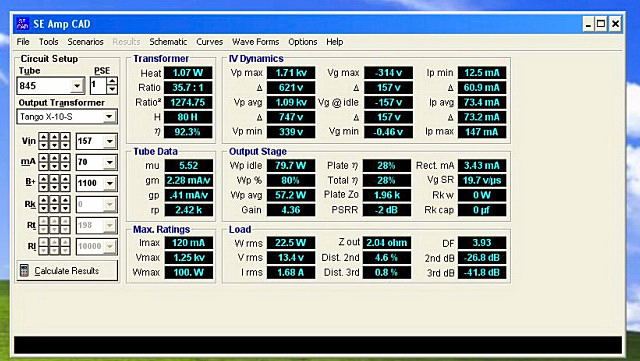
Then switch to the results screen. This screen gives all of the important parameters in the output circuit. You can modify the parameters in the circuit setup panel and watch things change in real time. If you ever tried to draw load lines, and then change a parameter, and then redraw the load line until you get what you want, you will love this program. It will even draw the load lines and they will change in real time when you change the parameters. There is some important information here. In the "output stage" panel we see that the tube is dissipating 79.7 watts (80% of max) when the amplifier is idling (no input signal). When the amplifier is operating at full power the tube is dissipating 57.2 watts (Wp avg). This makes sense since 22.5 watts are delivered to the load. In the "load" screen you can see the 22.5 watts output. The output impedance is 2.04 ohms yielding a damping factor of 3.93. Second and third harmonic distortion is given in both DB and percentage. These are all of the parameters that you will watch while you play with the B+ voltage, tube current, load impedance, and drive voltage (Vin) in the "circuit setup" panel until you are happy with the results. Once you choose a B+ voltage, tube current, and load impedance, grab the Vin slider and start increasing the drive voltage. You will see the power output increase. The distortion will begin to increase also.
The necessary information for implementing PowerDrive (or any driver) is in the "IV dynamics" panel. Pay attention to the "Vg min" parameter. This is the peak positive going swing for the grid voltage. If you intend to stay in A1, this must remain a negative number. Increase the drive voltage until this value approaches zero. In this simulation the Vg min is -.46 volts. This corresponds to 22.5 watts output and just over 5% THD. This is typical for an 845 amp. My 845 amp made about 20 watts at 5% before I added PowerDrive. In this panel, look at the Vg@idle parameter. This is the DC grid bias voltage required for this tube under the chosen conditions. Also important is the Vg max parameter. This is the peak negative going swing for the grid voltage. This tube requires about 315 volts P-P of drive under these conditions. In case you haven't realized it yet, this is a bunch of drive voltage. The 845 is known for being hard to drive.
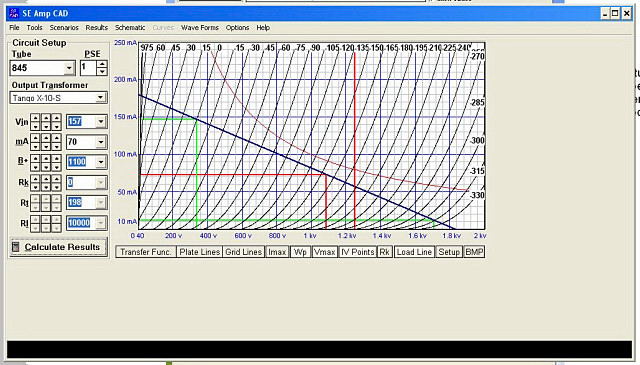
This is the load line screen from the above simulation (click the curves pull down). You could draw this manually to yield the same data. The curves are from the 845 data sheet. The sloping dark blue line is the 10K ohm load line. The thin curved curved red line is the maximum dissipation line. The load line is comfortably below the maximum in this case. The thick vertical red line at 1250 volts is the maximum plate voltage spec. The chosen operating point must be to the left of this line. The two intersecting red lines correspond to the chosen operating point, 1100 volts and 70 mA. The intersection of these two lines gives you the DC bias point from the curves. The static grid bias voltage is read from the plate curves. In this case we get -157 volts (just to the right of the -150 volt line). The AC signal applied to the grid will swing between zero volts (to remain in A1) and twice the bias voltage (-314 volts). These are the green lines on the chart.
We know how much grid voltage is required for biasing the tube to 70 mA, but how much adjustment should we have and what bias voltage is required to get there? We could easily get these numbers from TubeCad by adjusting the tube current slider, and watching the Vg@idle spec. How much adjustment range should we have? In my designs I like to have enough range to be able to cut the tube completely off on initial power up of a new amplifier. In the amp simulations above I get 1 mA of tube current with -223 volts on the grid. How far up should we go? The maximum tube current spec is 120 mA which is obtained with -137 volts on the grid. We should design our bias network to allow adjustment of the DC bias voltage from -137 volts to - 223 volts. I often provide a little extra to accommodate weak tubes. In this 845 amplifier I would use -130 volts to -230 volts.
Those with experience with load lines may notice that this tube operates close to cutoff at the negative signal extreme. The plate current drops to 12.5 mA at the lowest point. This causes the third harmonic to rise as the amp approaches full power, and the clipping will not be symmetrical. This amp will clip the negative going excursion before the positive going excursion clips. This is in the simulation world. In the real world an Chinese 845 will start to draw some grid current as the grid approaches -5 volt, and the real amp exhibited fairly symmetrical clipping with these bias conditions. It is highly possible that the Chinese 845 tubes do not exactly match the 70+ year old RCA data sheet.
We have shown that under these conditions we need to bias the tube at -157 volts, and drive it with 314 volts peak to peak. These are the requirements for A1 operation. In order to find out what happens in A2, simply turn up the drive voltage (Vin). Increase the drive voltage, minimum grid voltage goes positive, it will turn red. The distortion will rise at a quicker rate than in A1. You could keep cranking up the drive, but you will reach the point where the Ip min reaches zero. This means that the tube is going into cutoff at the negative signal extreme. These simulations only concern the output stage. A perfect driver that can source infinite grid current is assumed.
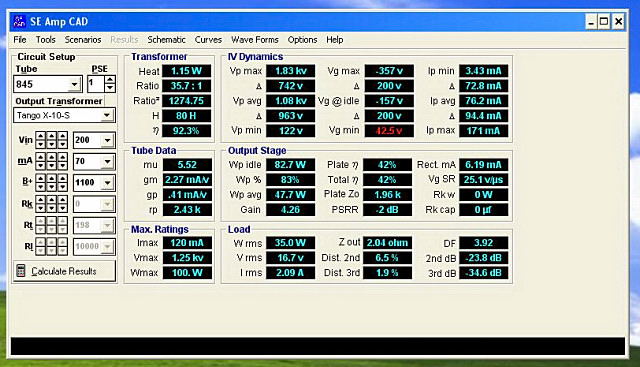
In this case nothing but the drive voltage was changed. Now the grid is swinging from +42.5 volts to -357 volts. The -157 volt bias value has not changed, but now we need 400 volts peak to peak of drive voltage. It is important to note that the output stage is EXACTLY THE SAME for the A1 amplifier and the A2 amplifier. If we build a driver stage that can supply all of the grid current the tube demands as the grid goes positive, we have an amplifier capable of A2 operation. Both amplifiers behave exactly the same up until the point that the output tubes grid begins to draw current. In an A1 amplifier the driver will distort badly as it attempts to drive the grid positive. There will likely be recovery time issues and associated distortions as well. The A1 amplifier is limited to about 20 watts in this case. If the driver circuit is capable of sourcing enough grid current, up to 35 watts of power are available from the exact same output stage at slightly higher distortion. Operation below 20 watts remains unchanged.
Extreme operation
I have often been asked why I tend to turn everything up to the max, and run tubes at or above the maximum ratings in SE mode. We will explore that here.
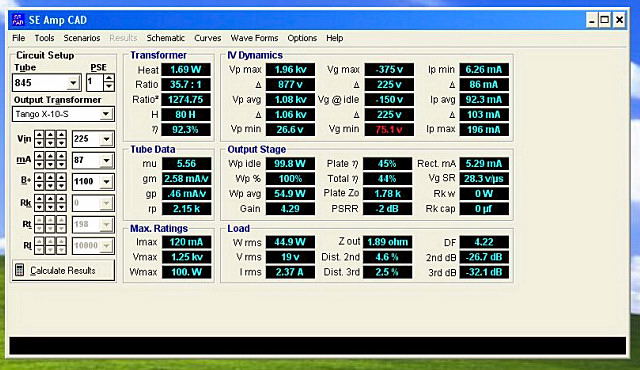
In this simulation, I decided to crank up the tube current to 100% of the maximum rating. I experimented for a while to come up with the set of conditions here. Here the amp is making 45 watts without violating any of the tubes specs. This is about twice the power that most 845 amps make. The distortion numbers improve at EVERY POWER LEVEL. So does the damping factor.
845 SE Simulations
| A1 amp | A2 amp | A2 maxed amp | |
|---|---|---|---|
| Damping Factor | 3.93 | 3.93 | 4.23 |
| Distn @ 1W | 0.8 - 0.0 | 0.8 - 0.0 | 0.7 - 0 |
| Distn @ 5W | 1.9 - 0.1 | 1.9 - 0.1 | 1.5 - 0.1 |
| Distn @ 10W | 2.8 - 0.3 | 2.8 - 0.3 | 2.1 - 0.1 |
| Distn @ 20W | 4.2 - 0.7 | 4.2 - 0.7 | 3.2 - 0.3 |
| Distn @ 22W | 4.6 - 0.8 | 4.6 - 0.8 | 3.4 - 0.4 |
| Distn @ 25W | - | 4.9 - 1.0 | 3.6 - 0.4 |
| Distn @ 30W | - | 5.7 - 1.3 | 4.1 - 0.6 |
| Distn @ 40W | - | 7.2 - 3.0 | 4.8 - 1.1 |
| Distn @ 45W | - | - | 4.6 - 2.6 |
This chart shows the distortion (2nd - 3rd) and damping factor for various power levels for the 3 amp cases shown here. There are TubeCad simulations, but I have verified these results with measurements and listening tests. The higher order harmonics are not shown in there simulations, but they are often reduced by increasing the tube current. The same effects are seen in the simulations that I did for the SSE amp design.
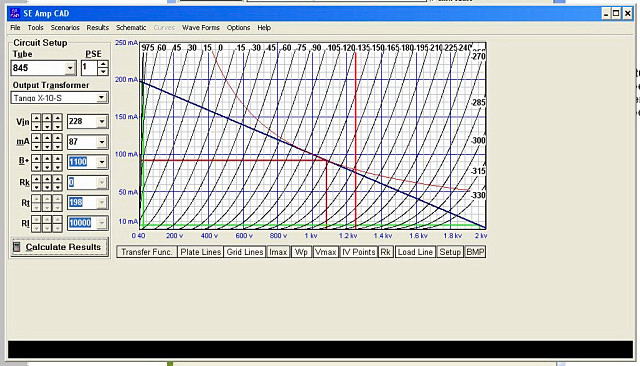
If you look at the curves here you will see that we are truly using up all that this tube has to give. The load line (dark blue) is touching the maximum dissipation line (thin curved red) and the plate voltage is swinging from near cutoff to near saturation (green lines). You can see in the results box above that the plate efficiency is 45%. This is approaching the theoretical maximum 50% for an A2 amp. This set of conditions push the tube into the non linear regions near cutoff and saturation which are responsible for the 2.5% 3rd harmonic distortion figures at full power. We need a static grid bias voltage of -150 volts and 450 volts peak to peak of drive voltage to get here though. 450 volts peak to peak is hard to do but this is the worst case conditions with one of the hardest tubes to drive. Screen driven sweep tubes are right there too.
I don't advocate operating rare or expensive tubes near their maximum ratings, but Chinese 845's were $30 each when I built this amp. I figured that it was a good compromise to give up some tube life for better sound. Even if you never intend to run the tubes at their maximum ratings, I believe that it is a good idea to build that capability into an amp. I run my original RCA 845's (and 211's) at 65 to 70 mA, I however have turned the current up to 100 Ma when using a pair of Chinese 845's. The same pair of tubes that were in the amp when I built it are still in it today.
It is important to realize that these are simulations with a sine wave at full power. This is not what you are going to listen to. Most music has at least a 10 db peak to average ratio. 20 db is not uncommon. Depending on the efficiency of your speakers the average power for a normal listening level may be about one watt or less, far less with high efficiency speakers. This is why many audiophiles stress the importance of maximizing the amplifiers quality in the first watt. Assuming an average listening level of one watt the 10 db peaks common in most music will ask the amplifier to produce 10 watts for a brief instant. Since all three examples above can produce 20 watts with ease they will all have no problem with this transient.
What happens when the drummer whacks the rim of the snare drum with the drum stick. This transient may be 16 db above the average listening level. Now the amplifier must produce 40 watts for a brief instant. The first amplifier will distort terribly when hit by the transient, and may take several hundred milliseconds to recover after the transient has passed. The second amplifier will exhibit about 10% THD during the transient, it is on the edge of clipping. There will be no recovery time since there was no overload. This event will be heard as some slight "blurring" of the sound or loss of definition, attack or "slam" on the rim shot only. The third amplifier will produce this sound faithfully since clipping starts at about 48 watts. I used these numbers to illustrate a point. A bigger transient could push any of these amplifiers into clipping, it is what happens immediately after the transient that we hear as objectionable.
Do we need to do all of this?
I did these simulations to illustrate what is going on in the output stage. What if you don't want to go through all of this. Is there an easier way? From these simulations we can see that we need about -150 volts of DC bias on the grid with 450 volts peak to peak of drive voltage. We can use the plate curves and draw a load line similar to the ones shown above and get the same results. Do we even need to go this far? We saw in the example above that we need about 315 volts peak to peak for the A1 case, and 450 volts peak to peak for the extreme A2 case. We see that we need -157 volts of bias voltage for the A1 case, and -150 volts for the extreme A2 case. This is assuming an IDEAL TUBE that perfectly matches a data sheet that was written in 1933! Those tubes don't exist, so we must provide for some bias adjustment range. How much, and how do you figure it out? Well, we can refer to the tube curves.
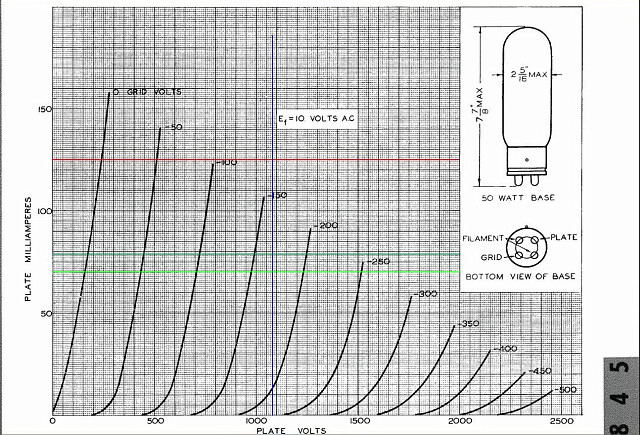
These are the plate curves from the Amperex 845. We realize that there are no curves for positive grid voltage, the grid lines are spaced every 50 volts, and they don't exactly match the curves given in TubeCad. My experience says that the TubeCad curves are more accurate even when dealing with vintage tubes, but often these are all we have to use. I drew a vertical blue line at 1075 volts. This is the B+ voltage minus the drop across the output transformer. It shows up as black on this chart. There are two green horizontal lines corresponding to 70 and 78 mA These are the two choices for operating current in this design. You have to interpolate (guess) the approximate grid voltage needed to get the desired current. It looks like about -170 and -175 volts for the two cases. This would be the static DC bias voltage. How much adjustment range should we have? In my designs I like to have enough range to be able to cut the tube completely off on initial power up. What grid voltage curve are we on when our 1075 volt vertical line crosses the Y axis (0 ma)? It is hard to say, but I would go for -240 volts. How far up should we go? The maximum tube current spec is the horizontal red line. It looks like -140 volts on the grid would get us there. I would allow a few extra volts to account for tube differences, so go for about -130 volts. These numbers agree pretty close to the TubeCad generated numbers.
How much drive voltage do we need. To get this one correct we really need to draw a load line, but there is an easy way to guess that will get us close. We saw in the extreme case above that the tube was nearly cutoff at one extreme and nearly saturated at the other extreme. We can just assume that the tube does actually cutoff and saturate and simply pick those numbers off of the plate curves. This will overestimate the drive requirements by 10 to 20%. If we were dealing with reasonable drive levels we should just use these overestimated numbers so that the driver would have some headroom. This will allow it to remain in its most linear region over its entire operating range. It also assures us that the output stage will be the first (and only) stage to clip when the amp is overdriven. In this case 450 volts of drive is already a tough condition.
How do we do that? There is one thing to remember about a tube working into an inductive load, the plate voltage can swing from nearly zero to TWICE THE STATIC PLATE VOLTAGE. For one extreme, assume zero plate current and twice the plate voltage voltage or 2150 volts. Read the grid voltage required for these plate conditions off the chart. It looks like about -480 volts. How do we determine the positive swing that is required? If we had lines for positive grid voltage, we could use them. How? We have to make an assumption about the maximum plate current that can be drawn. Without drawing a load line, we must assume that the tube is cutoff, and the plate voltage has risen to its maximum value (twice the static plate voltage) of 2150 volts. A serious transient comes along and instantly saturates the tube. This puts all of the energy stored in the OPT's primary inductance into the load which in this case is 10K ohms. 2150 volts into 10K ohms is 215 mA. In reality the tube would have 20 to 50 volts across it in saturation, so we find a point on the plate curves at say 40 volts and 215 mA. This happens to be in a place on the chart where there are no grid lines, so we must guess. We could draw a +50 volt line on the chart with equal spacing from the other lines, and this point is to the left of it, so I will guess +70 volts. This "guestimate" gives us a drive requirement of 550 volts peak to peak.
Summary
In order to design a PowerDrive circuit we need to know expected range of voltages required at the output tubes grid, both DC and AC. We need to know the total drive voltage needed by the output in order to design the driver circuit (450 to 550 volts peak to peak in this case). We also need to know the minimum and maximum voltage excursions needed at the output tubes grid (+75 to -375 volts). We need these voltages in order to set up the mosfet circuit. Overestimating these voltages will cause increased dissipation in the mosfet, underestimating them will cause some of the most ugly sounding distortion that you have ever heard, so if you have to guess, guess high.